


Equities have duration in the same mathematical sense as bonds. Yet the numbers appear inconsistent: the S&P 500’s cash flows imply a duration of several decades, while its observed sensitivity to interest rates is usually much lower. The discrepancy arises because theoretical duration holds cash flows constant, while real-world rate moves also change expectations for growth, inflation, risk premia, and earnings. This post explains the difference, and what equity duration can and cannot tell investors.
From Bond to Perpetuity
A bond promises a fixed schedule of nominal cash flows. Its Macaulay duration is the present-value-weighted average time until you receive them:
The weights above are each cash flow's share of present value, so they sum to one. Duration is a genuine probability-weighted mean of times, measured in years. A zero-coupon bond maturing in ten years has a duration of exactly ten.
Separately, and apparently unrelatedly, you can ask how the price P responds to a change in yield. That is modified duration, a sensitivity with some connection to time:
Differentiate the price with respect to yield and the algebra hands you the weighted average time, divided by one plus the yield. Each cash flow's price elasticity happens to be proportional to its own maturity, and elasticities aggregate linearly in present-value weights, so "average waiting time" and "price sensitivity" turn out to be the same number wearing two labels. Under continuous compounding the divisor disappears and they are literally identical.
Perpetuity provide the bridge to equities. An instrument that pays a fixed coupon forever has no maturity at all, yet its duration is finite and completely well behaved; in particular, the duration of an infinitely-lived claim is just the reciprocal of its yield.
An equity is a perpetuity. The only complication is that its coupon grows. In addition, bond duration rests on four other assumptions that equities violate.
Bond cash flows are contractual; equity cash flows are forecasts. Bond cash flows are nominal; equity cash flows are broadly real. Bond cash flows are fixed; equity cash flows grow at a rate that is itself estimated. And most importantly, bond cash flows are exogenous to the discount rate: when the Treasury curve moves, the coupons on a Treasury do not move with it. Corporate cash flows absolutely do.
From Perpetuity to Stock
The Gordon growth model prices a perpetuity whose cash flow Dn grows at a constant rate g and is discounted at r (i.e. how a stock hypothetically behaves). Price is
Differentiating gives the duration
Showing that the modified duration of an equity is the forward price-to-dividend ratio, assuming all shareholder returns are returned via dividends and not buybacks.
Equity duration is therefore a restatement of valuation. Any sentence of the form "growth stocks are long duration" is, under this model, the same sentence as "growth stocks are expensive," and carries exactly as much information.
Note also that duration is a rectangular hyperbola in the gap between the discount rate and the growth rate, which produces the explosive behaviour,
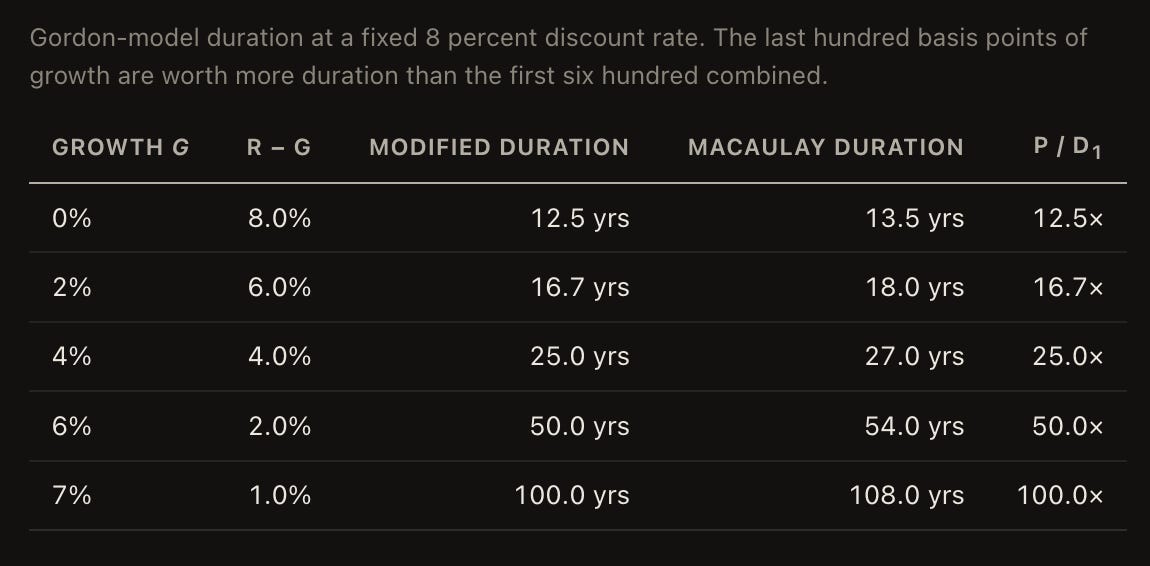
Halving the gap doubles the duration. Long-duration valuations are not merely sensitive to assumptions, they are unbounded in them. Now differentiate with respect to growth instead:
Equal in magnitude, opposite in sign: r and g enter the pricing function only through their difference, so the two partials must be negatives of each other everywhere. The asset does not know, and cannot know, whether the spread narrowed because the discount rate fell or because the growth rate rose. Write the total differential
shows that price responds only to the change in the spread, amplified by the multiple. If growth and discount rates rise together one for one, price is exactly unchanged, at any multiple, forever. Take the second derivative and something else falls out:
Convexity scales with the square of the forward multiple. And duration falls with the square of itself as rates rise, which means the asset shortens as it gets cheaper and lengthens as it gets more expensive. Duration is a state variable, not a constant. A regression estimated over a long sample spanning very different multiple regimes is estimating a moving target, and will report an average that describes no actual period.
Duration Interpretation
When Citrini writes that
Investors are always either discounting the promise of the future or the reality of the present. And they are never equally weighting them.
During the early part of a hype cycle, leading up to and directly following a technological advancement, investors are typically discounting the future while focusing on the present. A good example for this is Nvidia at the end of 2022: investors were solely focused on the headwinds presented by the crypto GPU glut, the anemic gaming PC market and the recent rise in rates causing fears about a near term recession.
Then, as the cycle begins, investors begin to shift to incorporate the future - they stop focusing so much on the present and see the promise. They move out in terms of valuing away from last twelve months current price / current earnings to next twelve months. Then, as price climbs and the technology becomes more exciting, their imagination takes hold. At a certain point they begin discounting the present much more heavily and the future becomes the only thing that matters. Valuation metrics over the next twelve months become useless in favor of 2, 3 or 5 years forward.
At the peak, the present is not considered at all, it is 100% driven by an imagined future (even when that imagination doesn’t necessarily align with a bullish outcome for the stocks driving the rally). Analysts aggressively raise estimates in ways that, at the time, seem fundamentally justifiable (if you take the assumptions at face value - for example, “everyone in the world will have two cell phones” was a good one from the mobile phone hype cycle). Capital is sucked in which ultimately forces performance chasing and crowds stocks with money that doesn’t really believe in the thesis. “A twilight period where people continue to play the game, but no longer believe in the rules” emerges, as Soros put it.
The valuation of SaaS stocks in mid-2021 is a great example of what happens when the future is overvalued relative to the present - nobody cared about climbing inflation, that rates had nowhere to go but up, that these companies were reliant on ZIRP or that software could become more competitive.
Then, a negative catalyst occurs - this can but doesn’t have to be related to the technology, macro, credit, underwhelming earnings. The estimates start to seem unattainable, and the present begins to matter more when the future seems more uncertain. That exact mechanism that drove future optimism to unsustainable heights mechanically reverses, everyone needs out. The future begins to be discounted until it results in a sense of disillusionment with not just the stocks but the technology itself. This overshoots to the downside, investors eventually become disillusioned and seemingly allergic to anything having to do with the technology. This happens in a very asymmetric manner to the climb (“stairs up, elevator down”).
This is the crucible in markets for truly transformative tech. If advancements persist, another opportunity to get long presents itself before capital once again begins flowing into the companies (the internet, for example). If they don’t - not necessarily “the tech goes away” but rather that it ceases to advance once the capital isn’t free or plateaus or the economics prove to be unfavorable - the cycle will still start again, just with a new technology.
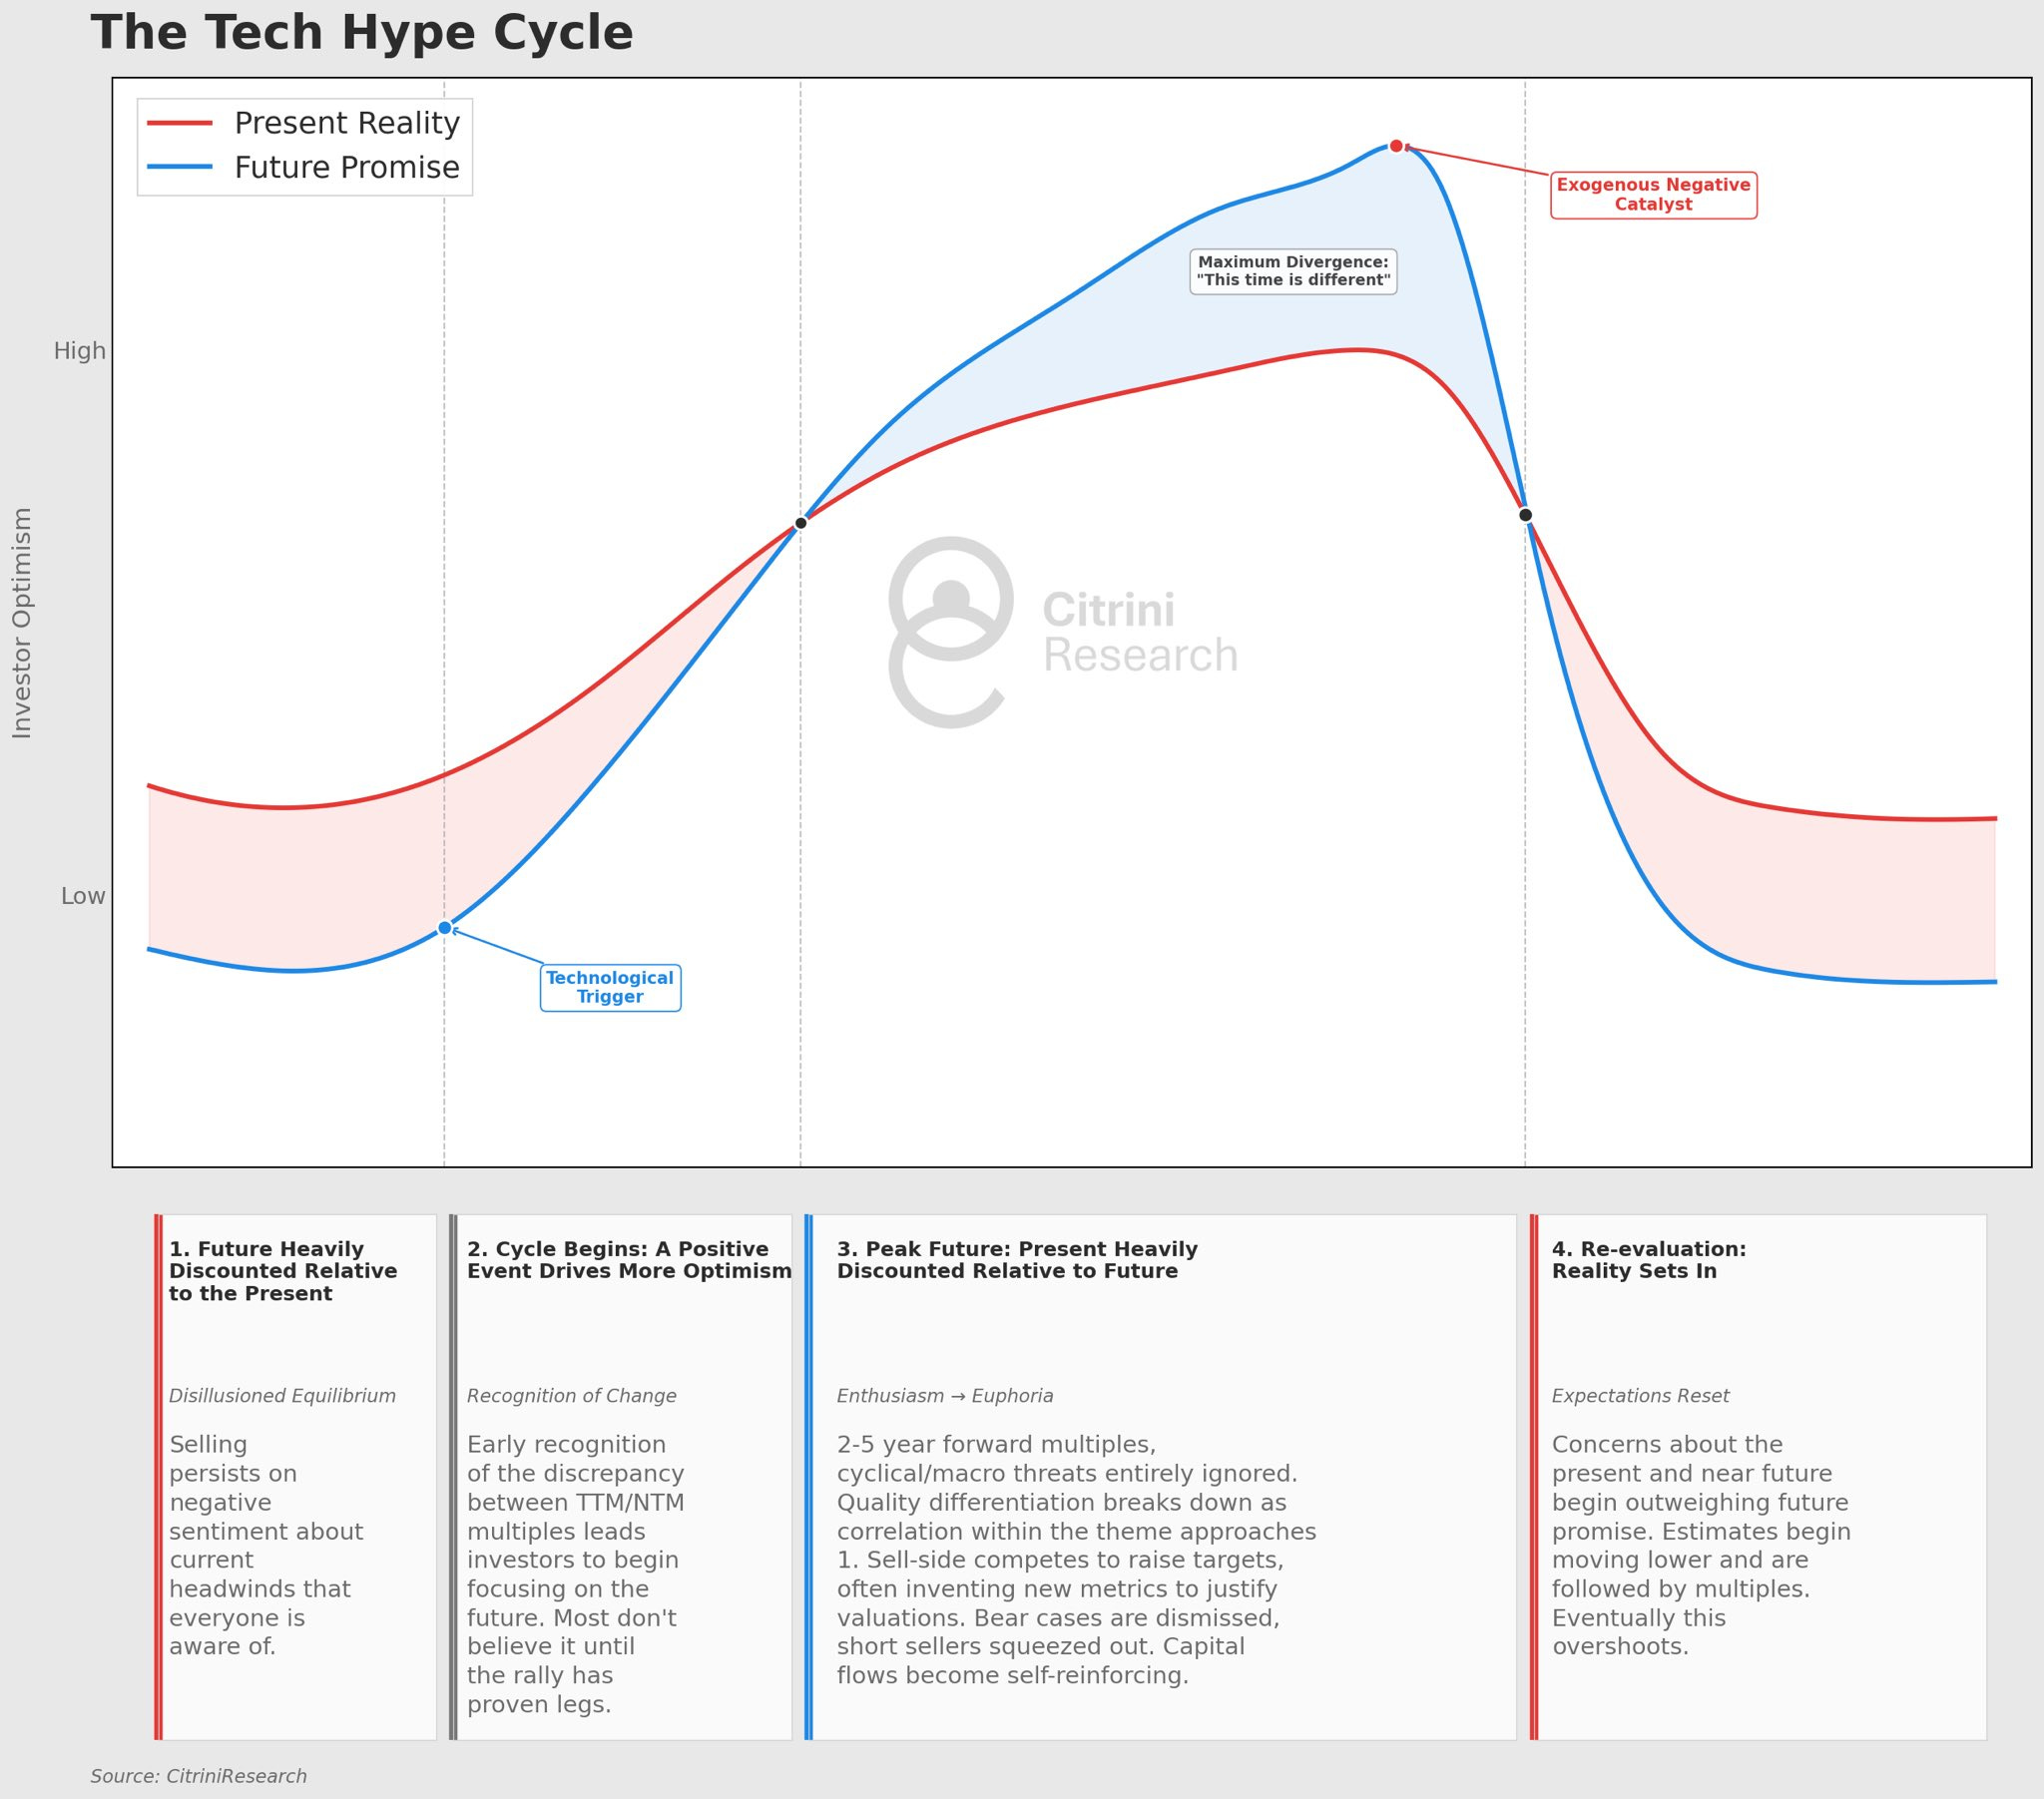
He is restating the point that early in a hype cycle, investors still anchor valuations to current earnings and near-term risks, so the stock behaves like a relatively short-duration asset; as enthusiasm builds, analysts raise long-term growth estimates, investors push the valuation horizon from the next twelve months to three, five, or more years out, and an increasing share of the stock’s value comes from distant expected cash flows.
The stock therefore becomes longer duration, and highly sensitive to changes in interest rates, discount rates, and long-run growth assumptions, but less sensitive to present-day earnings. At the extreme, a quarterly earnings report may become almost a non-event unless it changes the perceived long-term trajectory, because investors are valuing the imagined future rather than current fundamentals.
When a negative catalyst undermines those distant growth assumptions or raises the discount rate, duration compresses abruptly, the present matters again, and the same mechanism that drove the stock upward reverses, often producing the familiar “stairs up, elevator down” dynamic.
The Impact of Inflation
Let inflation be π, let the nominal discount rate be r + π, and let nominal cash-flow growth absorb inflation with a pass-through coefficient λ:
At full pass-through, where companies in aggregate raise prices with inflation exactly one-to-one, λ = 1 and equity has exactly zero duration to expected inflation. At λ = 0 it behaves like a long nominal bond. So the popular framing "equity is a very long nominal bond" gets the inflation term precisely backwards.
The better analogy is that equity is a perpetual inflation-linked bond: real-rate exposure yes, inflation exposure no. That also implies the correct benchmark for equity's discount-rate exposure is the TIPS curve, not the nominal curve, which turns out to matter a great deal when you actually run the regressions.
Setting λ = 0 when it should 1 is called the Modigliani-Cohn money illusion: capitalising real cash flows at nominal discount rates. It is also the error embedded in the Fed model, comparing a real number (the earnings yield) to a nominal number (the Treasury yield), which is the objection Cliff Asness raised in 2003.
Decomposing the S&P 500 dividend yield into a rational growth forecast, a subjective risk premium, and a residual mispricing term, shows that inflation explains close to 80 percent of the time-series variation in the mispricing component, with high inflation associated with underpricing in the broad equity markets.
The Impact of Convexity
Consider two companies, valued with an explicit ten-year forecast plus a terminal perpetuity, with the duration computed as a present-value-weighted average of times. The terminal block is not a lump sum arriving at year ten but a perpetuity beginning at year eleven, and its own Macaulay duration measured from today is:
The value stock: Payout ratio 60 percent, growth 2 percent, discount rate 8 percent. Normalizing earnings to 1, this prices at 10.2 times earnings. Of its total present value, 43.5 percent sits in the first ten years of dividends and 56.5 percent in the terminal block, whose own duration is 28.0 years. The weighted average comes to a Macaulay duration of 18.00 years, or 16.67 modified.
The growth stock. Payout 10 percent, growth 12 percent for a decade then fading to 3 percent, same 8 percent discount rate. This prices at 19.0 times earnings, and 93.5 percent of its value sits in the terminal block. Macaulay duration: 29.93 years, or 27.72 modified. A summary of their cashflows is shown below
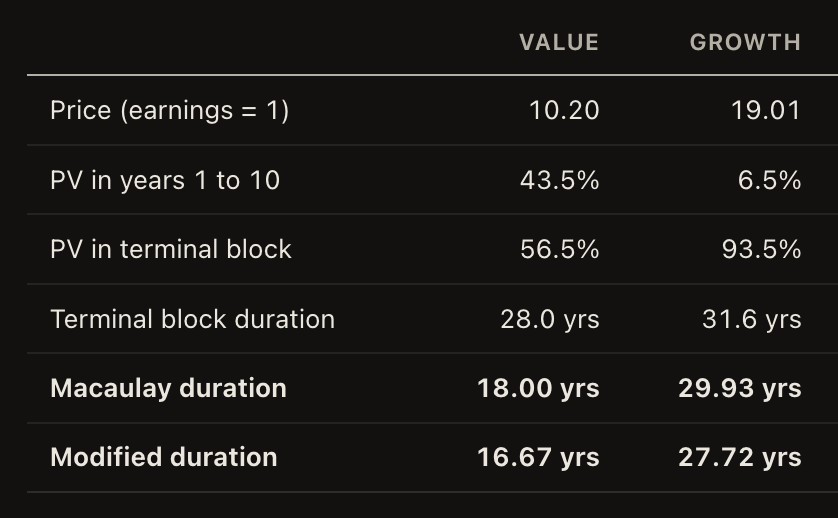
Equity duration is violently convex. The growth stock loses 22.8 percent on a 100 basis point rise and gains 35.1 percent on a 100 basis point fall. Any hedge ratio set from a point-estimate duration is wrong in both directions, and wrong asymmetrically (rate cuts makes stocks go up more than rate hikes).

Cashflow Duration of S&P 500
Gordon growth model inverted says the forward payout yield is the discount-rate gap, so duration is simply the reciprocal of the payout yield.

Moving from the dividend yield to the total payout yield collapses the S&P duration from 77 years to 30, a factor of 2.5, before any economics enters at all. Since the late 1990s the majority of US corporate cash distribution has run through buybacks rather than dividends. So the economically correct denominator in P/D is net payout.
30 years still seems long against empirical estimates that are far shorter. How much shorter is genuinely contested. An unanticipated 25 basis point cut in the fed funds target is associated with roughly a 1 percent rise in broad stock indexes, which implies something on the order of 4 percent per 100 basis points. Generally a figure of “2 to 6 years” to fed funds circulates widely in practitioner writing.
Of course, a fed funds surprise is NOT a move in the long real rate that actually discounts the cash flows, and a 25bp funds surprise moves the ten-year by considerably less than 25bp. Scaled against the right denominator the implied duration would be meaningfully higher.
Growth and Rates
Additional gap between empirical equity duration and the duration derived from cashflows can be explained by the positive long term correlation between interest rates and growth; let g' = dg/dr then
Real interest rates and real GDP growth are often positively correlated because stronger growth raises the demand for capital: firms want to invest more, households consume more, and the central bank may keep policy tighter to prevent overheating. At the same time, higher expected productivity growth increases the return on investment, so borrowers are willing to pay a higher real rate. Conversely, weak growth reduces investment demand and usually leads to monetary easing, pushing real rates lower. The relationship is therefore partly fundamental (higher growth raises the equilibrium real rate) and partly policy-driven.
In the neoclassical theory, the equilibrium real rate is anchored to trend growth by household patience regarding future versus present consumption
The Ramsey rule describes the steady state of the consumption Euler equation: where the real rate is expressed as the rate of time preference (rho) plus the curvature of utility (sigma) (risk aversion = inverse elasticity of inter-temporal substitution) times trend consumption growth (g). A fast-growing economy needs a high real rate to persuade households to defer consumption; a stagnant one cannot sustain it. Empirically, the relationship between real rates and growth is well-observed.
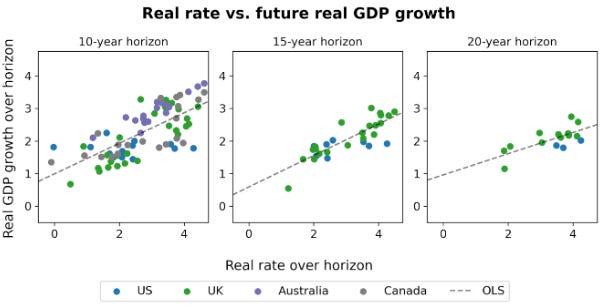
Model duration is therefore a partial derivative: the response to a pure discount-rate shock with cash flows held fixed. Empirical duration is a total derivative: the response to whatever actually moves yields in the sample, which is mostly news about nominal growth. They are different objects, both correct, and the ratio between them is a direct estimate of how much of a rate move the market reads as growth news.
Assuming a 0.8 (or indeed, any reasonable number) beta between rates and growth means that 0.8 of any move in the ten-year yield is matched by a move in expected perpetual nominal cash-flow growth, which reduces the effective duration of the market by 80%. Notice also that the same formula explains negative duration. Whenever cash-flow expectations rise more than one for one with the discount rate, empirical duration goes negative and the asset appreciates when rates rise.
Correlations between average real rates and average growth are empirically noisy, and other factors such as demographics, safe-asset demand, regulation, play a dominant role in average real rates. Nonetheless, native estimates of equity duration that does not take into account the relationship between rates and idiosyncratic, sector, and macroeconomic growth typically overshoots. See example below from Campbell

A 100bp surprise rate change does not typically cause a 20% drawdown in the S&P; but the graph does correctly note that growth assets have longer durations.
Stock-Bond Correlation
Over long horizons, real interest rates and real economic growth should generally be positively related. Higher trend productivity and growth increase the expected return on capital. Slow-growing economies normally have less demand for capital and lower equilibrium real rates. That long-run relationship does not mean rates and growth must move together over every shorter period. Their short-run correlation depends on the type of shock driving the economy.
In a demand- or productivity-driven regime, growth expectations and rates usually move in the same direction. Stronger demand or productivity raises expected corporate earnings, but it also increases investment demand and may cause monetary policy to become tighter, pushing rates upward. If the earnings effect dominates for equities, stocks rise while higher yields cause bond prices to fall. Stocks and bonds therefore move in opposite directions, producing a negative stock–bond correlation. In a conventional recession, the process reverses: growth expectations and rates fall together, stocks decline and bond prices rise.
In an inflation-, supply- or policy-driven regime, rates and growth can move in opposite directions. A negative supply shock raises inflation while reducing real output, and the central bank may respond by raising rates despite deteriorating growth. An independent monetary tightening can produce the same combination: higher real rates and weaker expected growth. Stocks are hurt by both weaker cash flows and higher discount rates, while bonds fall because yields rise. Stocks and bonds therefore move together, producing a positive stock–bond correlation.
The reverse can also occur. A favorable supply or disinflation shock can improve expected growth while allowing rates to fall. Stocks then benefit from stronger earnings and lower discount rates, while bonds rise as yields decline. Again, stock and bond prices move together, so their correlation is positive.
Factor Interpretations
Value stocks are often described as short duration because more of their valuation is supported by current earnings, while growth stocks depend more heavily on distant cash flows. But this relationship is partly mechanical: expensive stocks are assigned longer duration because more of their market value lies beyond current cash flows. Saying that growth is expensive and that growth is long duration can therefore amount to stating the same fact twice.
Profitable companies are generally shorter duration because they already produce substantial earnings relative to their valuation. Less of their value must be justified by distant and uncertain growth. High-payout firms distribute cash through dividends or repurchases rather than retaining it for future projects. Investors receive more of the company’s value today and depend less on management successfully reinvesting capital for many years. Low-volatility stocks heavily correlates with value, profitability, and high-payout factors.
Aggressive investment reduces current free cash flow in exchange for the possibility of higher future cash flow. High-investment companies are therefore longer duration, while low-investment companies receive more of their economic value from existing assets and nearer cash flows. The investment factor is correlated with growth.
Momentum has no permanent duration exposure. It owns whatever has recently performed well. During a speculative technology rally, momentum may become heavily long duration. During a rally in banks, energy or other cyclical value sectors, it may become much shorter duration. Its rate sensitivity is inherited from the current winners rather than being a stable feature of the factor.
Small-cap rate sensitivity is primarily a credit and refinancing story rather than a pure duration story. Smaller companies often depend more heavily on floating-rate debt, bank financing and frequent refinancing. Higher rates therefore reduce their actual earnings and cash flows. This is a numerator effect, not merely a higher discount rate being applied to unchanged future cash flows.
Equity Term-Structure
The persistent and well-documented premium of the value, quality, and profitability factors over the growth and investment factors suggest that the equity term structure is persistently downward sloping. Short-maturity dividend claims and short-duration stocks have earn higher returns than distant cash flows and long-duration stocks. This is the opposite of the standard bond intuition that investors should receive a larger return for waiting longer.
One explanation is that investors systematically pay too much for distant cash flows. Faraway earnings allow greater freedom to assume enormous markets, persistent competitive advantages and decades of compounding. Because those assumptions cannot be tested immediately, narratives can support valuations for long periods. Near-term cash flows leave less room for imagination. They are visible, measurable and constrained by present operating reality. Investors may therefore overpay for distant growth and require higher expected returns to own less exciting, less sexy, nearer cash flows.
This unifies several persistent factor premiums. Value, profitability, low investment and high payout all tend to select companies whose valuations are supported by current or near-term cash flows. They may not represent completely separate anomalies, but rather be different expressions of the same tendency to overvalue long-duration equities.
Sector Durations
We use publicly available table of empirical rate betas, from D.E. Shaw, estimated on daily data from 2010 to 2021 by regressing sector returns on ten-year Treasury returns and the equity market, so the rate beta is orthogonal to equity beta. A positive Treasury beta means positive equity duration: the sector falls when rates rise.
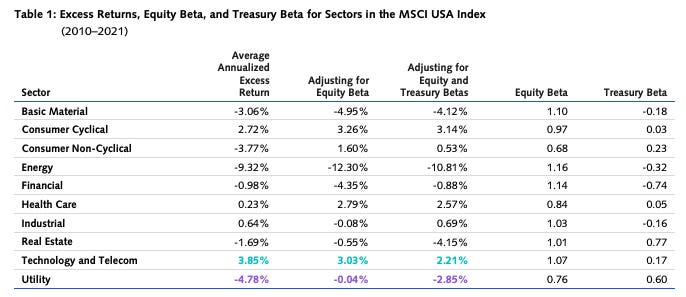
Technology has by a wide margin the longest cash-flow duration in the index: back-loaded earnings, minimal current payout, value concentrated in a distant terminal block. On the cash-flow-timing prediction it should top this table. It ranks fourth, barely above health care, at around a quarter of Utilities’ beta.
Technology cash flows are pro-cyclical, and so are interest rates. A rate rise carries two pieces of news at once: a higher discount rate, which is bad for long-dated cash flows, and stronger growth, which is good for cyclical ones. For technology the second partially cancels the first.
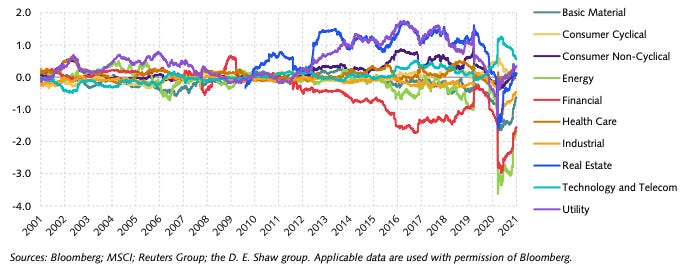
The tell is visible in the data: technology’s Treasury beta only spiked from the onset of COVID, when rate moves became purely about policy rather than about the cycle. Corroborating this, cross-sectional work finds that firms in cyclical sectors (energy, materials, industrials) exhibit higher measured rate sensitivities than non-cyclical sectors (staples, health care), which is the inverse of the pure cash-flow prediction.
Another possible explanation is the substitution effect: yield-starved investors move between bonds and high-payout stocks (the chase for yield). This effect has opposite implications for cash-flow duration. The mechanism is flows: when rates fall, money moves into income-oriented equity funds, whose managers overweight high-payout names, and the trade unwinds when rates normalize. Investors following a “live off the income” rule reaching for yield in exactly this way. The duration is therefore manufactured by the marginal buyer, not by the cash flows.
Banks & Financials
Banks and financials deserve their own treatment. Banks and similar entities borrow short and lend long (maturity transformation). Aggregate bank assets have an estimated duration of about a bit less than 4 years against less than half a year for liabilities, a gap of 3.5 years. At roughly 10x leverage on the balance sheet (10% reserves), a 100 basis point rate surprise should destroy about 34% of bank equity.
However, measured around FOMC meetings, the realized sensitivity is about 4.2 percent per 100 basis points (instead of 34%), against 3.7 percent for the market itself. Banks sit close to the median of sectors, and are no more rate-exposed than non-financial firms generally.
The resolution is within the business model. Banks pay high fixed operating costs (branches and salaries and marketing and technology) to buy market power over retail depositors, which lets them keep deposit rates low and insensitive. Economically, the deposit franchise is an interest rate swap: the bank pays the fixed leg (operating costs) and receives the floating leg (the deposit spread). It therefore has negative duration and rises in value when rates rise. Banks hold long-duration fixed-rate assets not despite this but because of it. Maturity transformation is a hedge, not a risk.
The deposit franchise is not a contract but a behavioral asset that exists only as long as depositors stay. Deposit betas averaged about 0.06 before the hiking cycle and rose above 0.81 from mid-2022 through 2023. The rate sensitivity of bank equity reversed, from +0.31 before the increase to −8.29 over mid-2022 through 2023. Marking bank assets to market for the 2022 to 2023 rate rise leaves the US banking system roughly $2.2 trillion below book, an average asset decline near 10 percent. When the depositors leave, the hedge evaporates.
Insurers are the mirror image. US life insurers' duration gap turned negative after the financial crisis, with liability duration now exceeding asset duration, so a parallel upward shift in the curve raises the value of their equity. Regress life-insurer stock returns on Treasury bond returns alongside the market, and the bond-return coefficient sits near zero before 2008 and near minus one after 2012, which at 2015 yield levels implied roughly an 8.8 percent equity decline per percentage-point fall in the ten-year (hence why insurer stocks did well during the 2022-2023 rate-hike cycle).
Closing Notes
Duration is a real property of an equity, correctly derived, and worth measuring. The mistakes come from importing bond intuition wholesale. Duration explains the cross-section of cash-flow timing. It also explains the time series of factor returns. It works cleanly where cash flows are genuinely bond-like, in utilities, REITs and staples.
Nonetheless, “equity duration” is a ceteris paribus statement being applied to a world in which ceteris is never paribus. That is not a reason to discard it. It is a reason to hold it the way you would hold any partial derivative: exactly correct about one channel, and silent about the others that usually dominate.
Disclaimer
The information provided on TheLogbook (the “Substack”) is strictly for informational and educational purposes only and should not be considered as investment or financial advice. The author is not a licensed financial advisor or tax professional and is not offering any professional services through this Substack. Investing in financial markets involves substantial risk, including possible loss of principal. Past performance is not indicative of future results. The author makes no representations or warranties about the completeness, accuracy, reliability, suitability, or availability of the information provided.
This Substack may contain links to external websites not affiliated with the author, and the accuracy of information on these sites is not guaranteed. Nothing contained in this Substack constitutes a solicitation, recommendation, endorsement, or offer to buy or sell any securities or other financial instruments. Always seek the advice of a qualified financial advisor before making any investment decisions.