

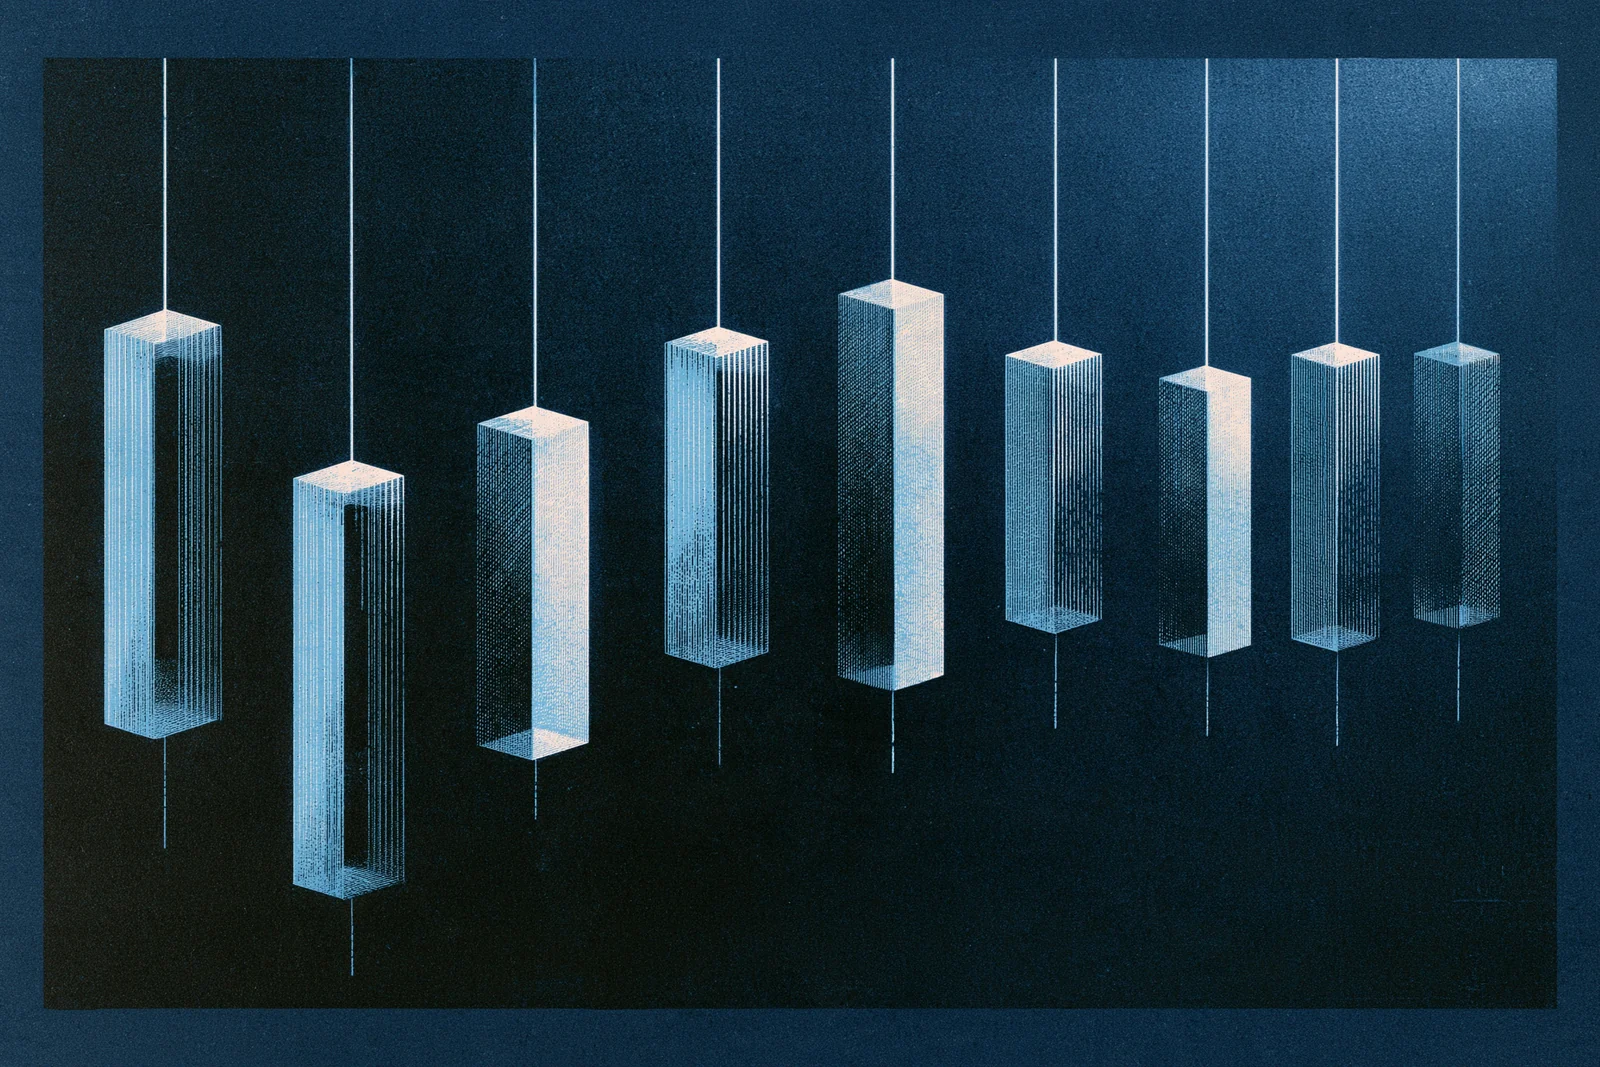
A candle compresses many transactions into four prices: the open, high, low and close over a chosen interval. That makes it a convenient summary. It also discards the order in which much of the trading occurred.
Learning to read candles starts with separating the information in those four numbers from the story we are tempted to attach to the shape.
Four prices, one candle
Suppose an interval opens at $100 and closes at $103, with a high of $104 and a low of $98. The body runs from $100 to $103. The upper wick is $1; the lower wick is $2. The total range is $6.
The close is five dollars above the low, or about 83% of the way up the range. That is a precise way to say the interval finished near its high. A rising candle does not mean there were more buyers than sellers: every executed trade had both. It says the last price was higher than the first.
The same shape can appear after a long rise, during a quiet range or after a major announcement. Those contexts can imply different questions even though the geometry is identical.
The missing path changes execution
Our candle could have followed $100 → $104 → $98 → $103. It could also have followed $100 → $98 → $104 → $103. Both paths produce the same open, high, low and close.
Now imagine a long entered at $100 with an exit for profit at $103 and a protective exit at $99. Under continuous fills at those levels, the first path reaches the profit exit first; the second reaches the protective exit first. The four candle numbers cannot tell you which happened.
A backtest using only those numbers must make an assumption or obtain finer data. TradingView’s broker-emulator documentation shows why fill logic, delays and slippage are explicit settings. A result can change because of execution assumptions even when the signal and chart look unchanged.
Real execution adds queue position, bid-ask differences and gaps. A high that touches your limit does not prove that your order would have filled. A stop can trigger at a level without filling exactly there.
The market and the interval
A chart may use last trades, midpoint quotes, a reference index or a mark price. A perp’s own trades can differ from its reference asset. Make sure the series matches the decision you are making.
Time boundaries matter too. A daily candle depends on where the day begins and ends. Including extended trading can produce a different high, low and close from a regular-session-only chart. A pattern that exists under one setting may disappear under another.
An unfinished candle is still changing. If a rule requires a close above $103, touching $103 during the interval is insufficient. Historical charts make completed closes easy to see; a live trader has to wait until the close is actually known.
What a pattern might explain
Instead of treating a long lower wick as an automatic buy, ask what occurred: price traded lower and later recovered. Was that recovery associated with new information, stronger buying or simply a brief trade in a thin market? What would you expect to happen next if the proposed explanation were right?
Formal research can investigate such questions. Lo, Mamaysky and Wang found that certain systematically defined patterns contained additional information in their historical stock sample, while explicitly distinguishing that finding from proof of excess trading profits.
A useful test defines the pattern before inspecting the results, states when it becomes known and uses executable entry and exit assumptions. Candles then become a compact language for describing price behavior. The trading argument still has to explain why that behavior should matter after costs.